Network-forensics/Puzzle4
FORENSICS CONTEST - Puzzle #4: The Curious Mr. X (2010-02-14)
Quick answers
| Question | Anwer | Detail |
|---|---|---|
| 1. What was the IP address of Mr. X’s scanner? | 10.42.253.253 | See detailed answer |
|
2. For the FIRST port scan that Mr. X conducted, what type of port scan was it?
|
TCP Connect | See detailed answer |
| 3. What were the IP addresses of the targets Mr. X discovered? |
|
See detailed answer |
| 4. What was the MAC address of the Apple system he found? | 00:16:cb:92:6e:dc | See detailed answer |
| 5. What was the IP address of the Windows system he found? | 10.42.42.50 | See detailed answer |
| 6. What TCP ports were open on the Windows system? (Please list the decimal numbers from lowest to highest.) |
|
See detailed answer |
|
7. X-TRA CREDIT (You don’t have to answer this, but you get super bonus points if you do):
|
Nmap | See detailed answer |
Detailed answers
General information
We first want to check file integrity, by issuing following command:
$ md5sum evidence04.pcap
804648497410b18d9a7cb1d4b2252ef7  evidence04.pcap

       Figure 1. MD5 sum to check file integrity
Figure 2 indicates that capture duration is about 10 minutes long. It doesn't give us enough information to determine whether the scan has been prepared (via a script or a tool). Nevertheless, a deeper analysis in the frames enables to withdraw the hypothesis of a manual scan.
File name: /home/sdamaye/forensics/puzzle4/evidence04.pcap
File type: Wireshark/tcpdump/... - libpcap
File encapsulation: Ethernet
Number of packets: 13625
File size: 1093865 bytes
Data size: 875841 bytes
Capture duration: 606.082082 seconds
Start time: Wed Feb  3 00:34:06 2010
End time: Wed Feb  3 00:44:13 2010
Data rate: 1445.09 bytes/s
Data rate: 11560.69 bits/s
Average packet size: 64.28 bytes

       Figure 2. Capinfo provides capture duration
Another useful information concerns Protocol Hierarchy Statistics, provided by Tshark. It shows that we have to deal with TCP, UDP and ICMP.
Protocol Hierarchy Statistics
Filter: frame

frame                                    frames:13625 bytes:875841
  eth                                    frames:13625 bytes:875841
    ip                                   frames:13625 bytes:875841
      tcp                                frames:13581 bytes:868753
        nbss                             frames:26 bytes:2663
        data                             frames:2 bytes:332
        dcerpc                           frames:1 bytes:90
      udp                                frames:24 bytes:3256
        nbns                             frames:20 bytes:1888
        data                             frames:4 bytes:1368
      icmp                               frames:20 bytes:3832

       Figure 3. Protocol Hierarchy Statistics provided by Tshark
Argus (http://qosient.com) provides a quick way to identify hosts.
$ argus -r evidence03.pcap -w evidence03.ra
$ rahosts -r evidence04.ra
10.42.42.25: (3) 10.42.42.50, 10.42.42.253, 10.255.255.255
10.42.42.50: (3) 10.42.42.25, 10.42.42.253, 10.255.255.255
10.42.42.56: (1) 10.42.42.253
10.42.42.253: (3) 10.42.42.25, 10.42.42.50, 10.42.42.56

       Figure 4. List of hosts
In addition, combining racluster with rasort immediately shows that the majority of the traffic is coming from 10.42.42.253, which (it will be confirmed later) seems to be the attacker's (Mr. X) IP address.
$ racluster -M norep -m saddr daddr -nr evidence04.ra -w - \
  | rasort -L0 -m bytes -s saddr daddr pkts bytes
           SrcAddr            DstAddr  TotPkts   TotBytes
      10.42.42.253        10.42.42.25     5411     348608
      10.42.42.253        10.42.42.50     4070     259759
      10.42.42.253        10.42.42.56     4024     257038
       10.42.42.25        10.42.42.50       96       7548
       10.42.42.50     10.255.255.255       12       1104
       10.42.42.56       10.42.42.253        2        740
       10.42.42.50        10.42.42.25        4        416
       10.42.42.25     10.255.255.255        4        368
       10.42.42.50       10.42.42.253        1        190
       10.42.42.25       10.42.42.253        1         70

       Figure 5. Distribution of traffic by host
What was the IP address of Mr. X’s scanner?
Based on the distribution of the traffic (see figure 5), it seems that the IP address of Mr X. is 10.42.253.253. This hypothesis is confirmed by the following table, provided by pyScanXtract.py:
Src IP -> Dst IP	              # scans
----------------------------------------
10.42.42.25  -> 10.42.42.50	      12
10.42.42.253 -> 10.42.42.25	    3403
10.42.42.253 -> 10.42.42.50	    2018
10.42.42.253 -> 10.42.42.56	    2005

       Figure 6. Flows (src and dst IP addr. analysis)
Indeed, we notice that traffic is only originating from 10.42.42.253 and 10.42.42.25. In addition, 10.42.42.253 is the only address not beeing scanned, and 10.42.42.25 is scanned by 10.42.42.253. We deduce that 10.42.42.253 is the IP address of Mr. X.
For the FIRST port scan that Mr. X conducted, what type of port scan was it?
The scans
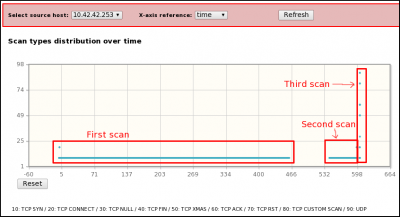
Still with the help of the Web Interface of pyScanXtract.py, we easily answer this question. Indeed, from the Scan distribution characteristics view, with filters on the source host (10.42.42.253) and on X-axis reference (time), we identify three different blocks. By zooming on the graphs and using pyScanXtract frames details, we obtain:
- first scan: from time 0s (frame #1) to 462.187269s (frame #6727). This scan seems to be globally composed of TCP SYN scans, but we see 2 TCP CONNECT() on frames #779 and #4381). When TCP CONNECT scan is used against CLOSED ports, there is no way to differentiate from a TCP SYN. Indeed, no ACK is sent from the attacker to complete the 3-way handshake.
- second scan: from time 543.230227s (frame #6728) to 597.071025s (frame #13532). This scan, launched 81 seconds after the end of the first one, has the same characteristics as the first scan (TCP CONNECT). We can observe 2 open ports on frames #13527 and #13528.
- Third scan: from time 603.075410s (frame #13533) to the end. This scan, launched 6 seconds after the end of the second one, is composed of TCP CONNECT(), TCP NULL, TCP XMAS, TCP ACK, UDP and TCP custom scans. No real way to confirm if we also have TCP SYN.
The FIRST scan is a TCP CONNECT() scan.
TCP SYN, TCP Connect, TCP ACK, UDP, TCP XMAS and TCP RST
Examples of scan techniques are given below:
TCP SYN
Only SYN TCP flag is activated. This technique is also called "half connection" since it doens't complete the connection (standard 3-ways handshake: SYN - SYN/ACK - ACK). Indeed, only first 2 steps are used. It enables quick scans and raises the probability of not beeing detected by Intrusion Detection Systems (IDS) / Intrusion Prevention Systems (IPS). If the port is OPEN, target answers with a SYN/ACK to our SYN probe, whereas we should receive a RST/ACK if the port is CLOSED.
TCP Connect
This technique is also called Vanilla connect. Like for TCP SYN, it sends a TCP packet with SYN flag activated, but completes the connection by sending a ACK to acknowledge the reception of a SYN/ACK in case the port is OPEN. The attacker then closes the connection by sending a RST. If the port is CLOSED, as for TCP SYN, target sends a RST/ACK.
This type of portscan is USED in the shape of this puzzle.
Example of an OPEN port (frames #4381, #4383, #4389 and #4394):
        +--------------+     +--------------+
        | 10.42.42.253 |     | 10.42.42.50  |
        +-------+------+     +-------+------+
                |                    |
#4381 42214/tcp | ------- SYN -----> | 135/tcp   seq=2994045278
#4383 42214/tcp | <---- SYN/ACK ---- | 135/tcp   seq=2938239898, ack=2994045279
#4389 42214/tcp | ------- ACK -----> | 135/tcp   seq=2994045279, ack=2938239899
#4394 42214/tcp | ----- RST/ACK ---> | 135/tcp   seq=2994045279, ack=2938239899

       Figure 8. TCP CONNECT against an OPEN port
Again in Figure 8, we see a strange behavior concerning sequence numbers. Indeed, packet on frame #4394 uses the same seq. num. as for frame #4389.
TCP ACK
This technique doesn't give indication about OPEN or CLOSED ports, but gives indication about rules implemented on an eventual firewall if any. Indeed, port will be considered as UNFILTERED if a RST is sent as a response to our ACK packet. On the other hand, if the port is FILTERED, we won't get response to our probe, or we will receive an ICMP port unreachable error (type 3, code 1, 2, 3, 9, 10 or 13).
This type of portscan is USED in the shape of this puzzle and shows only UNFILTERED ports.
Example of an UNFILTERED port (frames #13606 and #13607):
         +--------------+     +--------------+
         | 10.42.42.253 |     | 10.42.42.50  |
         +-------+------+     +-------+------+
                 |                    |
#13606 36135/tcp | ------- ACK -----> | 135/tcp  seq=1405980936, ack=4233401440
#13607 36135/tcp | <------ RST ------ | 135/tcp  seq=4233401440

       Figure 9. TCP CONNECT against an UNFILTERED port
UDP
In this case, a UDP packet without data is sent to the target. If the port is CLOSED, an ICMP port unreachable error (type 3, code 3) is received. If the port is FILTERED, an ICMP type 3 (destination unreachable), code 1 (host unreachable), 2 (protocol unreachable), 9 (network administratively prohibited), 10 (host administratively prohibited) or 13 (communication administratively prohibited) is received. It is unusal to receive an UDP packet as a response, but in this case, it means the port is OPEN. At least, if no response is received, even after many retransmissions, it means that the port is OPEN or FILTERED.
This type of scan is used in the shape of this puzzle.
Example of a CLOSED UDP port (frames #36581 and #36583)
         +--------------+     +--------------+
         | 10.42.42.253 |     | 10.42.42.25  |
         +-------+------+     +-------+------+
                 |                    |
#13581 36045/udp | ------- UDP -----> | 39217/udp
#13583 36045/udp | <----- ICMP ------ | 39217/udp
                     (type 3, code 3)

       Figure 10. UDP scan against a CLOSED port
TCP XMAS
This type of scan consists of sending a packet with FIN, PUSH and URG TCP flags. A RST received from target indicates that port is CLOSED. If no response is received, it will indicate that the port is OPEN or FILTERED. And an ICMP type 3, code 1, 2, 3, 9, 10 or 13 will indicate a FILTERED port.
This type of scan is used in the shape of this puzzle.
Example of a CLOSED port (frame #13600 and #13602):
         +--------------+     +--------------+
         | 10.42.42.253 |     | 10.42.42.25  |
         +-------+------+     +-------+------+
                 |                    |
#13600 36138/tcp | -- FIN/PSH/URG --> | 1/tcp  seq=1405980936, ack=4233401440
#13602 36138/tcp | <---- RST/ACK ---- | 1/tcp  seq=0,          ack=1405980936

       Figure 11. TCP XMAS against a CLOSED port
The presence of a ack num on packet #13600 is really ambiguous since ACK flag is not present (XMAS scan).
TCP RST
Also called "inverse mapping", this technique enables to identify hosts that are up on a network. A packet with only TCP RST flag set is sent to target. In case this latest is up, no response is received. On the contrary, an ICMP host unreachable packet is received if there is no host at tested IP.
This scan technique hasn't been found in the pcap file. All RST packets in the pcap file correspond to connection resets (e.g. SYN>SYN/ACK>ACK>RST).
Other scan types
Other scans have been found in the pcap file: TCP NULL and custom scans.
TCP NULL
A TCP NULL scan consists of sending a packet with no TCP flag set. It sometimes enable to pass through firewalls which rules are based on standard flags settings. Interpretation of results is the same as for TCP XMAS scan.
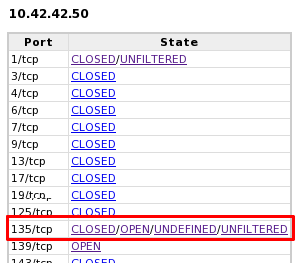
From the report generated by pyScanXtract.py, it is interesting to notice that we have 2 opposite interpretations (OPEN and CLOSED) for port 135/tcp on host 10.42.42.50. The details of the frames are shown below:
         +--------------+     +--------------+
         | 10.42.42.253 |     | 10.42.42.50  |
         +-------+------+     +-------+------+
                 |                    |
#13597 36133/tcp | ---- TCP NULL ---> | 135/tcp  seq=1405980936, ack=4233401440
#13598 36133/tcp | <---- RST/ACK ---- | 135/tcp  seq=0,          ack=1405980936

       Figure 12. TCP NULL against a Windows machine
According to the response (RST/ACK), we should deduce that the port is CLOSED. But as we will demonstrate later, 10.42.42.50 is a Windows host, and as stated by Cisco Press (see below), Windows machines don't comply to RFC793 and send RST packet even if the port is OPEN.


CUSTOM SCANS
Two custom scans have been identified by pyScanXtract.py:
              +-----+-----+-----+-----+-----+-----+-----+-----+
  TCP flags   | ECE | CWR | URG | ACK | PSH | RST | SYN | FIN |
              +-----+-----+-----+-----+-----+-----+-----+-----+
frame #13590  |  x  |  x  |     |     |     |     |  x  |     |
              +-----+-----+-----+-----+-----+-----+-----+-----+
frame #13603  |     |     |  x  |     |  x  |     |  x  |  x  |
              +-----+-----+-----+-----+-----+-----+-----+-----+

       Figure 13. Custom TCP scans
The scan on frame #13590 is like a TCP SYN but with additional ECE and CWR flags set. In this example, we get the same answer as for a TCP SYN (SYN/ACK).
The scan on frame #13603 is like a XMAS scan but with additional SYN flag set.
What were the IP addresses of the targets Mr. X discovered?
Exploiting the results of pyScanXtractpy (see figure 6), we conclude that discovered targets are:
- 10.42.42.25
- 10.42.42.50
- 10.42.42.56
What was the MAC address of the Apple system he found?
From the "Discovered hosts" section of the generated report (pyScanXtract.py), we see following result:
+--------------+-------------------+----------------------------------------+
| Host         | MAC addr.         | Vendor                                 |
+--------------+-------------------+----------------------------------------+
| 10.42.42.25  | 00:16:cb:92:6e:dc | Apple Computer                         |
| 10.42.42.50  | 70:5a:b6:51:d7:b2 | COMPAL INFORMATION (KUNSHAN) CO., LTD. |
| 10.42.42.56  | 00:26:22:cb:1e:79 | COMPAL INFORMATION (KUNSHAN) CO., LTD. |
| 10.42.42.253 | 00:23:8b:82:1f:4a | Quanta Computer Inc.                   |
+--------------+-------------------+----------------------------------------+

       Figure 14. Discovered hosts (provided by pyScanXtract.py)
According to the packets from 10.42.42.25 (extraction of ethernet header data), pyScanXtract.py detects that associated physical address is 00:16:cb:92:6e:dc. Exploiting "IEEE OUI and Company_id Assignments" database available at http://standards.ieee.org/regauth/oui/oui.txt, it is possible to obtain the name of the vendor: Apple Computer.
We could have used passive OS fingerprinting with p0f to validate our hypothesis but as Figure 15 shows, our host is not recognized (UNKNOWN).
$ p0f -M -N -l -q -s evidence04.pcap | grep '^10.42.42.25:'
[+] End of input file.
10.42.42.25:49260 - UNKNOWN [65535:64:1:64:M1460,N,W3,N,N,T,S,E:P:?:?] (up: 2462 hrs)
10.42.42.25:49261 - UNKNOWN [65535:64:1:64:M1460,N,W3,N,N,T,S,E:P:?:?] (up: 2462 hrs)
10.42.42.25:49262 - UNKNOWN [65535:64:1:64:M1460,N,W3,N,N,T,S,E:P:?:?] (up: 2462 hrs)
10.42.42.25:49263 - UNKNOWN [65535:64:1:64:M1460,N,W3,N,N,T,S,E:P:?:?] (up: 2462 hrs)
10.42.42.25:49264 - UNKNOWN [65535:64:1:64:M1460,N,W3,N,N,T,S,E:P:?:?] (up: 2462 hrs)
10.42.42.25:49265 - UNKNOWN [65535:64:1:64:M1460,N,W3,N,N,T,S,E:P:?:?] (up: 2462 hrs)
10.42.42.25:49266 - UNKNOWN [65535:64:1:64:M1460,N,W3,N,N,T,S,E:P:?:?] (up: 2462 hrs)
10.42.42.25:49267 - UNKNOWN [65535:64:1:64:M1460,N,W3,N,N,T,S,E:P:?:?] (up: 2462 hrs)
10.42.42.25:49268 - UNKNOWN [65535:64:1:64:M1460,N,W3,N,N,T,S,E:P:?:?] (up: 2462 hrs)
10.42.42.25:49269 - UNKNOWN [65535:64:1:64:M1460,N,W3,N,N,T,S,E:P:?:?] (up: 2462 hrs)
10.42.42.25:49270 - UNKNOWN [65535:64:1:64:M1460,N,W3,N,N,T,S,E:P:?:?] (up: 2462 hrs)
10.42.42.25:49271 - UNKNOWN [65535:64:1:64:M1460,N,W3,N,N,T,S,E:P:?:?] (up: 2462 hrs)

       Figure 15. Passive OS fingerprint with p0f
We will conclude that the Apple system has 10.42.42.25 for IP and that his mac address is: 00:16:cb:92:6e:dc.
What was the IP address of the Windows system he found?
According to pyScanXtract.py report, host 10.42.42.50 is the only host that has OPEN ports. These latest are: 135/tcp (DCOM Service Control Manager) and 139/tcp (NETBIOS Session Service). According to GRC's website (http://www.grc.com/port_135.htm and http://www.grc.com/port_139.htm), these ports are common ports for Windows machines:
First indication: OPEN ports
- 135/tcp:
"Microsoft's DCOM (Distributed, i.e. networked, COM) Service Control Manager (also known as the RPC Endpoint Mapper) uses this port in a manner similar to SUN's UNIX use of port 111. The SCM server running on the user's computer opens port 135 and listens for incoming requests from clients wishing to locate the ports where DCOM services can be found on that machine."
- 139/tcp:
"TCP NetBIOS connections are made over this port, usually with Windows machines but also with any other system running Samba (SMB). These TCP connections form 'NetBIOS sessions' to support connection oriented file sharing activities."
Second indication: Behavior against our TCP NULL scan
On question 2, we have explained that Windows machine don't comply with RFC 793 in case of a NULL SCAN. The fact that another scan presumes that port 135/tcp is OPEN seems to confirm our presumption about the Windows machine.
Third indication: Distribution of IP-IDs
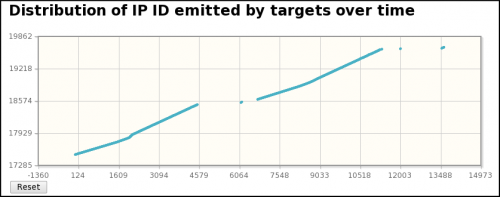
As we can see from pyScan Web Interface against host 10.42.42.50, IP-ID numbers are growing regularly, which is typical from Windows systems.
Fourth indication: IP-stack
IP stacks give us clues to passively fingerprint the OS. Honeynet has published a database (http://old.honeynet.org/papers/finger/traces.txt), enabling to determine OS, based on certain criteria (ttl, window, tos, ...). Using this database, we see that most (all?) of the packets originating from 10.42.42.50 have following characteristics:
- TTL: 128
- ToS: 0
Although this information is not very reliable, it is an additional indication that could confirm the host is a Windows machine.
Conclusion
These 4 indications seem to confirm our presumption: Windows machine has IP 10.42.42.50.
What TCP ports were open on the Windows system?
PyScanXtract.py shows two OPEN TCP ports on the "presumed" Windows machine (10.42.42.50):
- 135/tcp
- 139/tcp
X-TRA CREDIT

Assumptions
It exists many port scanners, for all operating systems. Here is a list of some of them:
- Nmap (http://nmap.org/download.html)
- Queso (http://tools.l0t3k.net/FingerPrinting/queso-980922.tar.gz)
- Xprobe2 (http://xprobe.sourceforge.net/)
- Ettercap (http://ettercap.sourceforge.net/)
- hping (http://www.hping.org/download.php)
- THC AMAP (http://freeworld.thc.org/thc-amap/)
- Angry IP Scanner (http://www.angryip.org/w/Download)
- Radmin Advanced Port Scanner (http://www.radmin.com/products/utilities/portscanner.php)
- Foundstone scanline (http://www.foundstone.com/us/resources/proddesc/scanline.htm)
and also manual crafting tools:
- Scapy (http://www.secdev.org/projects/scapy/)
- Nemesis (http://nemesis.sourceforge.net/)
and also vunerability scanners:
- Nessus (http://www.nessus.org/download/)
- SATAN (http://www.porcupine.org/satan/)
- OpenVAS (http://www.openvas.org/)
- LANguard Port Scanner (http://www.gfi.com/lannetscan)
Information we know
Information #1: Scan characteristics
pyScan Web Interface (Scan distribution characteristics module) provides these information:
TCP ports:
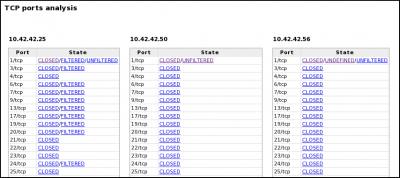
- The same TCP ports are scanned on the 3 targets
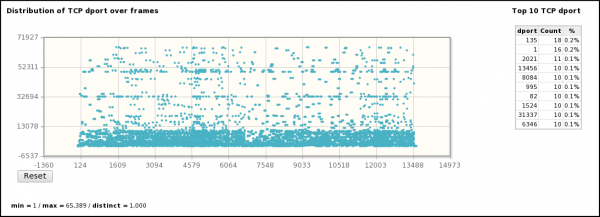
- 1000 distinct TCP ports are scanned between 1/tcp and 65389/tcp
- Some TCP ports are not scanned (2/tcp, 5/tcp, 8/tcp, 10/tcp, ...)
- TCP ports are randomly scanned (See figure 15 and graph "Distribution of TCP dport over time")
- Scan is highly concentrated on TCP ports < 10000 (see "Distribution of TCP dport over time")
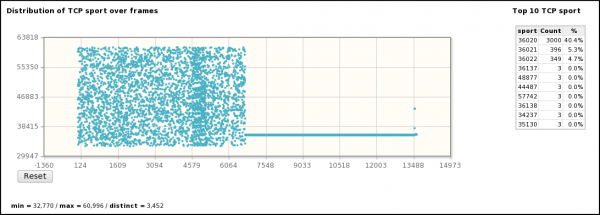
- Use of a random sport (between 32770 and 60996) on the first scan and a fixed value (36020/tcp) for the second one.
- Sequence numbers are regularly incremented (see graph "Distribution of seq over time") for the first scan and is fixed for the second scan.
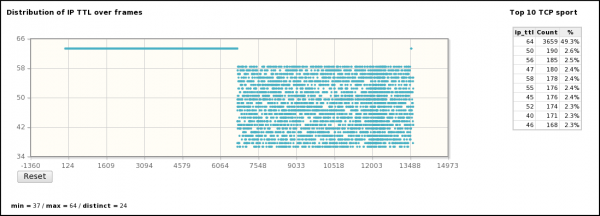
- The second scan uses all TTL values between 37 and 59
UDP ports:
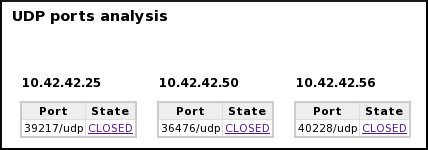
- Only 1 UDP port is scanned one each target and it is different for each.
Information #2: Scan techniques
We can see common scan techniques :
- TCP SYN
- TCP Connect()
- TCP ACK
- TCP XMAS
- UDP
- TCP NULL
And 2 custom TCP scans:
- TCP XMAS-like scan but with SYN flag set
- TCP SYN-like scan but with ECE and CWR flags set
There is no:
- TCP RST scan
Information #3: Host 10.42.42.25
It has been demonstrated that Mr. X's IP is 10.42.42.253. Nevertheless, some scans are realized by the Apple machine, which IP is 10.42.42.25.
In addition, Host 10.42.42.25:
- only scans 10.42.42.50 (Windows machine) on port 139/tcp
- only uses TCP Connect() scan technique
- combines "scans" with NBSS requests (Windows shares)
These "scans" are not "decoys" or "idle scan" from 10.42.42.253. Actually, they are attemps from 10.42.42.25 to connect to SMB shares on 10.42.42.50.
Information #4: Strange packets
Some packets originating from the source (10.42.42.253 or 10.42.42.25) seem to be manually crafted. Indeed, many packets have the same criteria:
- Use of same seq num for many packets
- Strange responses of the attacker (presence of ack num. while not activating ACK flag, no ack num. while activating ACK flag, aborting of connection with FIN/ACK instead of RST/ACK, ...)
Example of strange behaviors:
       10.42.42.25.49260     10.42.42.50.139
        -------+-------      -------+-------
               |                    |
6115     49260 | ------- SYN -----> | 139   seq=1142317008
6116     49260 | <---- SYN/ACK ---- | 139   seq=1436240505  ack=1436247009
6117     49260 | ------- ACK -----> | 139   seq=1436247009  ack=1436240506
               |                    |
6120     49260 | ------- ACK -----> | 139   seq=1142317081  ack=1436240512 [1]
6121     49260 | ----- FIN/ACK ---> | 139   seq=1142317081  ack=1436240512 [2]
6122     49260 | <------ ACK ------ | 139   seq=1436240512  ack=1142317082
               |                    |
6962     36020 | ------- SYN -----> | 139   seq=289350607
6973     36020 | <---- SYN/ACK ---- | 139   seq=1604535773  ack=289350608
6978     36020 | ------- ACK -----> | 139   seq=289350608   ack=[3]

   [1] Why ack (connection init)?
   [2] Why FIN-ACK with same seq?
   [3] ack num not specified while using ACK flag

       Figure 16. Example of strange packets with additional/missing info.
Information #5: Capture length
Capture (scan) is about 10 minutes long and contains 7438 scans, that makes: 7435 scans / 606 sec = 12.3 scans / sec. Either a tool has been used for this scan or a script has been written.
Tools
I haven't tested all port scanners to check if I could find similar signatures, but with all these information, here are our assessments:
Queso
- The presence of a scan with ECE/CWR/SYN TCP flags on frame 13590 could have been a signature of Queso. Indeed, Queso uses such packets to fingerprint the remote OS.
- Nevertheless, it is explained in the documentation that Queso "sends 7 packets (0-6), and compares the responses with the config file, where the different OSes are described, in a response-based way to each packet (differentiated by the dst port -my port)", which doesn't seem to be the case (see "Scan types distribution over time")
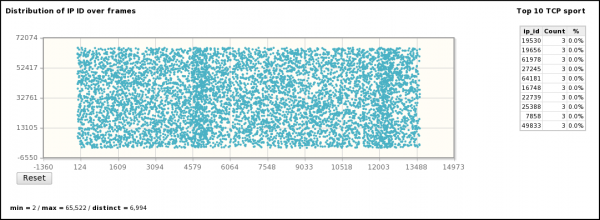
- In addition, Queso seems to choose random sport, between 4000/tcp and 65000/tcp. Based on the results of graph "Distribution of TCP sport over time", sport varies from 32770/tcp and 60996/tcp, with a large concentration (40%) on 36020/tcp.
- At least Queso seems to send far less packets than in the pcap file.
The hypothesis of Queso seems to be discarded.
Nmap
- Nmap is compatible with *nix systems. According to the IPID distribution from pyScanXtract Web Interface, we see randomly generated IPIDs, giving indications on the attacker's OS (probably *nix).
- Nmap seems to first check that scanned host is up with an ICMP request, which is not the case in the shape of this puzzle. Nevertheless, this is Nmap's default behavior, and -PN parameter enables to skip this step.
- Nmap is a very (the most?) complete port scanner, offering, among others, TCP SYN, TCP CONNECT, TCP ACK, TCP NULL, TCP XMAS, UDP and also custom scans through the --scanflags option.
- Nmap also enables to choose sport (--sourceport option)
- Nmap uses different ttl values (second scan) to identify remote OS
- Nmap offers the possibility of selecting tested ports, via the --top-ports option
It seems that the Nmap could be a possibility.
XProbe
It is stated in the documentation that:


It doesn't fit with the large amount of packets sent in the pcap file.
The hypothesis of XProbe seems to be discarded.
THC AMAP
THC AMAP doesn't seem to use other scan techniques than TCP SYN ad TCP CONNECT.
This hypothesis seems to be discarded.
Conclusion
As a conclusion, I think the most probable hypothesis is Nmap. Indeed, this port scanner is a very (the most?) complete port scanner that offers the possibility of controlling almost all parameters of the scan. In addition, typical signatures (scan types, fixed sport, distribution of TTL, ...) have been found thanks to pyScanXtract Web Interface.
Conclusions
This puzzle was really my favorite! It was really exciting to make the necessary reverse-engineering to reproduce the output Mr.X. has seen. It really requires strong knowledge on TCP/IP to make it and understand the exceptions.
I had the idea of initially developing only a Python script (my favorite language ;-), but found appropriate to use the data I had in the database to display other useful information and draw graphs. I am certain that pyScanXtract is a useful tool that I will use for future uses. That's why I have published it on Google Code (http://pyscanxtract.googlecode.com/files/pyscan.tar.gz) and identified some improvements I have reported in the README file.
At least, I really found interesting to analyse distribution graphs, and I promised myself to write a paper on it. I will let you review it when it will be done, and will prepare an exercise for you guys :-P
Scripts
See pyscanxtract
