Splunk
Description & Installation
What is Splunk?
Splunk (the product) captures, indexes and correlates real-time data in a searchable repository from which it can generate graphs, reports, alerts, dashboards and visualizations.
Installation
Install Splunk
$ cd /data/src/
$ wget -O splunk-6.4.0-f2c836328108-Linux-x86_64.tgz 'https://www.splunk.com/bin/splunk/DownloadActivityServlet?architecture=x86_64&platform=linux&version=6.4.0&product=splunk&filename=splunk-6.4.0-f2c836328108-Linux-x86_64.tgz&wget=true'
$ sudo tar xzf splunk-6.4.0-f2c836328108-Linux-x86_64.tgz -C /opt/
Enable boot autostart
To enable boot-start:
$ cd /opt/splunk/
$ sudo bin/splunk enable boot-start
Init script installed at /etc/init.d/splunk.
Init script is configured to run at boot.
If you have previously started splunk daemon, stop it:
$ sudo bin/splunk stop
Stopping splunkd...
Shutting down.  Please wait, as this may take a few minutes.
...
Stopping splunk helpers...

Done.
And restart it with systemctl:
$ sudo systemctl start splunk.service
Configuration
Change default log retention
Log retention is set to 6 years by default. This setting is set under the frozenTimePeriodInSecs parameter in the /opt/splunk/etc/system/default/indexes.conf configuration file (index specific defaults section). To overwrite this value, you should create an indexes.conf configuration file in /opt/splunk/etc/system/local/:
# echo "frozenTimePeriodInSecs = 7776000" >> /opt/splunk/etc/system/local/indexes.conf
Restart Splunk to apply the change:
$ sudo systemctl restart splunk
Upgrade Splunk
- Backup your splunk $SPLUNK_HOME/etc directory.
- Stop Splunk:
sudo systemctl stop splunk.service
- or
$SPLUNK_HOME/bin/splunk stop
- Confirm no other processes can start Splunk Enterprise automatically (e.g. systemctl, crontab, ...).
- To upgrade and migrate from version 5.0 and later, install the Splunk Enterprise package over your existing deployment:
sudo tar xzvf splunk-6.4.2-00f5bb3fa822-Linux-x86_64.tgz -C /opt/
- Execute the $SPLUNK_HOME/bin/splunk start command.
- Splunk Enterprise displays a warning message informing that the upgrade process is about to start and asks you to confirm.
- Choose whether or not you want to run the migration preview script to see proposed changes to your existing configuration files, or proceed with the migration and upgrade right away. If you choose to view the expected changes, the script provides a list.
- After you review these changes and are ready to proceed with migration and upgrade, run $SPLUNK_HOME/bin/splunk start again.
- Note: You can complete Steps 5 to 7 in one line:
- To accept the license and view the expected changes (answer 'n') before continuing the upgrade:
$SPLUNK_HOME/bin/splunk start --accept-license --answer-no
- To accept the license and begin the upgrade without viewing the changes (answer 'y'):
$SPLUNK_HOME/bin/splunk start --accept-license --answer-yes
Search examples
Unique values
source="*suricata*" AND event_type="alert" | stats values(alert.signature)

Don't use the above request for populating inputs (e.g. dropdown) in dashboards. Rather the following request:
source="*suricata*" AND event_type="alert" | table alert.signature | dedup alert.signature
Group by field
source="*suricata*" AND event_type="alert" | stats count by alert.signature | sort -count

Top results
Display count of alerts and percentage for each distinct src_ip (limited to 100 first results in the example)
source="*suricata*" AND event_type="alert" | top 100 src_ip

Group by several fields
source="*suricata*" | stats distinct_count(src_ip) AS src_ip,distinct_count(dest_ip) AS dest_ip,count by alert.signature,alert.category | sort -count

Add a sparkline to search results
source="*suricata*" | stats distinct_count(src_ip) AS src_ip,distinct_count(dest_ip) AS dest_ip,sparkline count by alert.signature,alert.category | sort -count

Timechart
source="*suricata*" AND event_type="alert" | timechart count by alert.signature

Select columns to show
source="*squid*" AND http_method!="CONNECT" | table _time, src_ip, url

Merge 2 fields
The below example shows how you can merge 2 source IP addresses coming from 2 feeds using different names and filter them with CIDR notation:
sourcetype=* | eval src=coalesce(src_ip,clientip) | where cidrmatch("192.168.2.0/24",src) | timechart count by src

Count by time
- | stats count by _time
- useful for charts (line, area, column)
- | stats count by date_hour
- count by hours
Reports & Dashboards
Single Value
source="*suricata*" event_type="alert" | timechart count

Column Chart
source="*suricata*" event_type="alert" | timechart count by alert.category

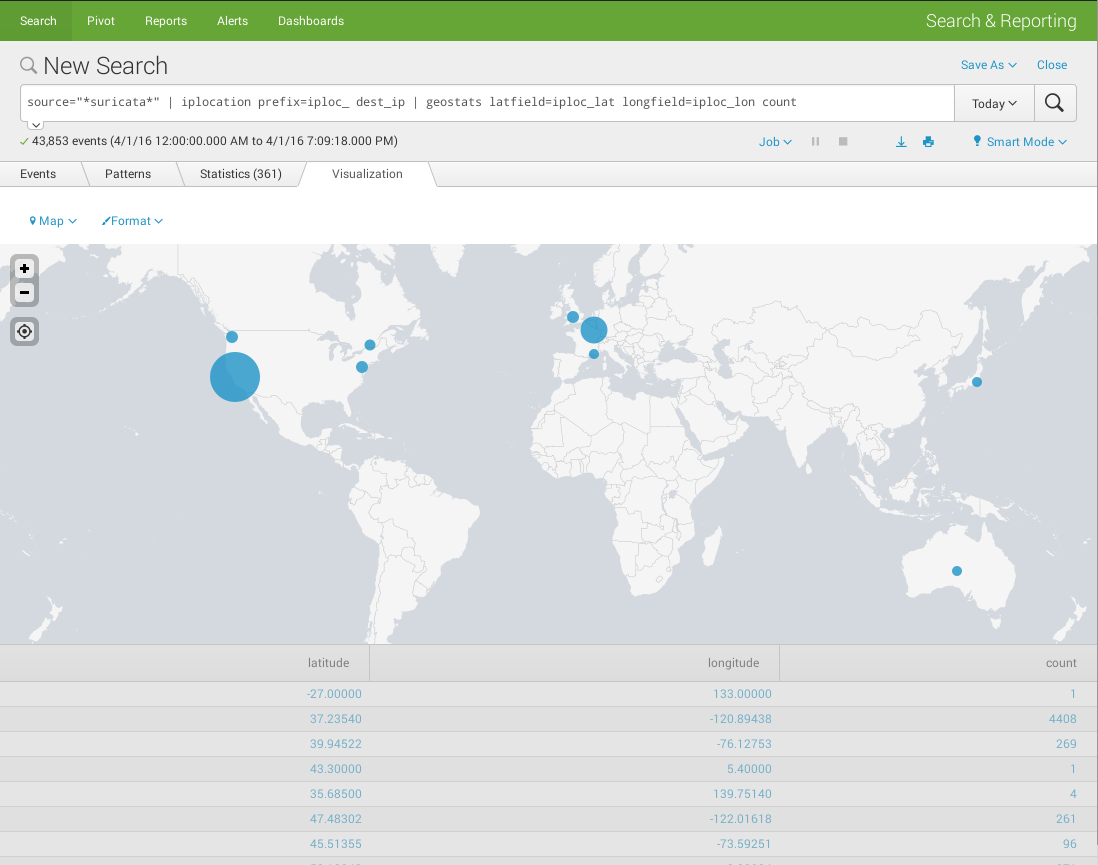
Cluster map
- Display the distribution of dest_ip implied in suricata events on a worldmap
- source="*suricata*" | iplocation prefix=iploc_ dest_ip | geostats latfield=iploc_lat longfield=iploc_lon count

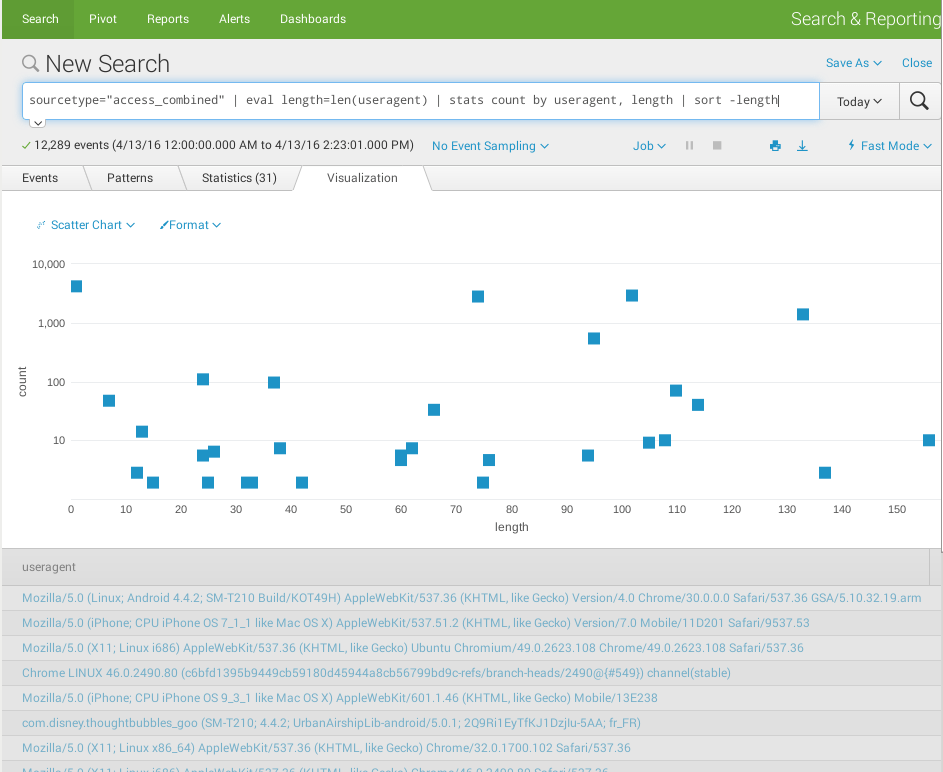
Scatter chart
- Show the distribution of user-agent length (info from squid proxy access.log in combined format)
- sourcetype="access_combined" | eval length=len(useragent) | stats count by useragent, length | sort -length

Time selection
To add a time picker to your dashboard:
- Open your dashboard in edit mode (Edit > Edit Panels)
- Add a time selector (Add input > Time) and configure it (click on the pen icon) as follows:
| Section | Key | Value |
|---|---|---|
| General | Label | Time Range |
| Search on change | checked | |
| Token Options | Token | TimeRangePicker |
| Default | Today |
On each widget that you would like to be automatically updated when the time range is changed, do as follows:
- Go to Inline Search > Edit Search String
- Set the Time Range Scope field to Shared Time Picker (TimeRangePicker)
Notice that if your widget has been added from an existing report (Add Panel > New From Report), you will need to clone it to an Inline Search first:

Form drilldown
Let's create a dropdown list that contains Suricata signatures and a pie chart that shows the distribution of source IPs. We would like to automatically update the pie chart when a new value is selected from the dropdown list:


To do that:
- First open the dashboard in edit mode: Edit > Edit Panels
- Then add a new input: Add input > Dropdown
- Click on the pen icon of the input object to edit its properties:
| Section | Key | Value |
|---|---|---|
| General | Label | signature |
| Search on Change | checked | |
| Token Options | Token | signature |
| Dynamic Options | Content type | Inline Search |
| Search string | table alert.signature | dedup alert.signature | |
| Time | All Time | |
| Field for label | alert.signature | |
| Field for value | alert.signature |
- Now edit the pie chart widget (Inline Search > Edit Search String) and add the token (notice that the token name should be surrounded by $) to your search:
source="*suricata*" AND alert.signature="$signature$" | top 100 src_ip
Regular expressions
Squid
Below is the regular expression I wrote to parse squid access.log (combined):
(?P<clientip>\S+)\s+(?P<ident>\S+)\s+(?P<auth>\S+)\s+\[([^:]+):(\d+:\d+:\d+)([^\]]+)\]\s+\"(?P<method>\S+)\s+(?<uri>\S+)\s+(?P<proto>[^/]+)/(?P<http_version>\S+)\"\s+(?P<http_status>\d+)\s+(?P<bytes>\d+)\s+\"(?P<referer>\S+)\"\s+\"(?P<user_agent>.*)\"\s+(?P<action>[A-Z_]+):(?P<enumerator>[A-Z_]+)

Advanced examples
- Youtube custom search command
- Table with expandable rows that show events associated + time picker to filter events
- SDSIEM (opensource SIEM I'm working on)
Make your own app
Structure
Apps are stored in $SPLUNK_HOME/etc/apps/. The structure of an app is as follows:
├── appserver
│   └── static
│       ├── application.css
│       ├── appLogo_allblack.png
│       ├── expand_alerts.js
│       ├── loader.gif
│       └── splIcons.gif
├── bin
│   └── readme.txt
├── default
│   ├── app.conf
│   ├── data
│   │   └── ui
│   │       ├── nav
│   │       │   └── default.xml
│   │       └── views
│   │           ├── siem-dashboard-alerts.xml
│   │           ├── siem-dashboard-overview.xml
│   │           └── siem-dashboard-useragent.xml
│   ├── savedsearches.conf
│   └── viewstates.conf
├── local
└── metadata
    ├── default.meta
    └── local.meta
Packing
Compressing
Once you have finished organizing your files, you can compress your application as follows:
$ cd $SPLUNK_HOME/etc/apps/
$ tar czf /data/mysplunkapps/appname.tgz appname/
Publish your app

Thank you for your comprehension.
Comments
Keywords: splunk