OllyDbg
Description
What is OllyDbg?
OllyDbg is an x86 debugger developed by Oleh Yuschuk. OllyDbg is commonly used by malware analysts and reverse engineers because it's easy to use and it has many plug-ins that extend its capabilities.
Versions
There are 2 main versions available for OllyDbg:
- Version 1: this version is still in use by many analysts because the majority of the plugins have been developped for this release
- Version 2: more advanced with new features but not all plugins have been ported yet for this version
OllyDbg's Interface
Main view
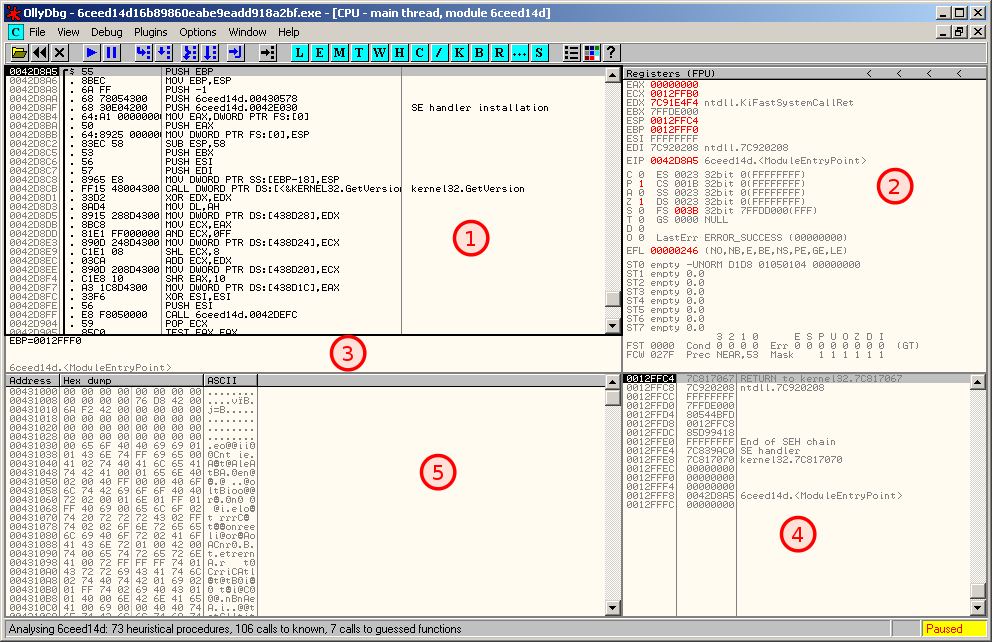
OllyDbg's main interface is split into 5 different regions as follows:
- Disassembler window: shows the disassembled code as it is executed
- Registers window: shows the registers along with their value in real time (when a value is changed, it appears in red). You can modify the value of these registers but right-clicking on the value.
- Information window: brings information about the current line of code (e.g. if a jump is taken)
- Stack window: current state of the stack in memory
- Memory dump window: dump of live memory for the debugged process
Main menu
| Executing code | Windows | |||||||||||||||||||||||||||||||||||||||||||||||||||||||
|---|---|---|---|---|---|---|---|---|---|---|---|---|---|---|---|---|---|---|---|---|---|---|---|---|---|---|---|---|---|---|---|---|---|---|---|---|---|---|---|---|---|---|---|---|---|---|---|---|---|---|---|---|---|---|---|---|
|
|
Windows
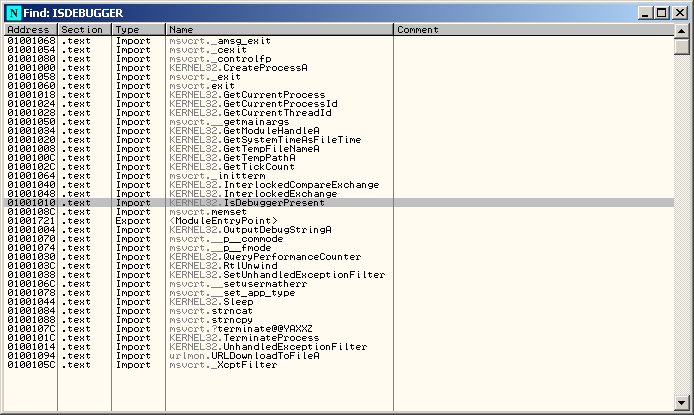
Names
The Names window shows the IAT:
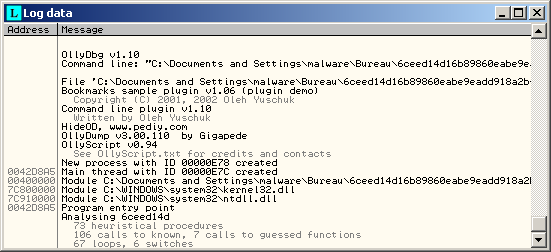
Log data
Displays logs.
Executable modules
Displays a list of executable modules loaded with the debugged program.
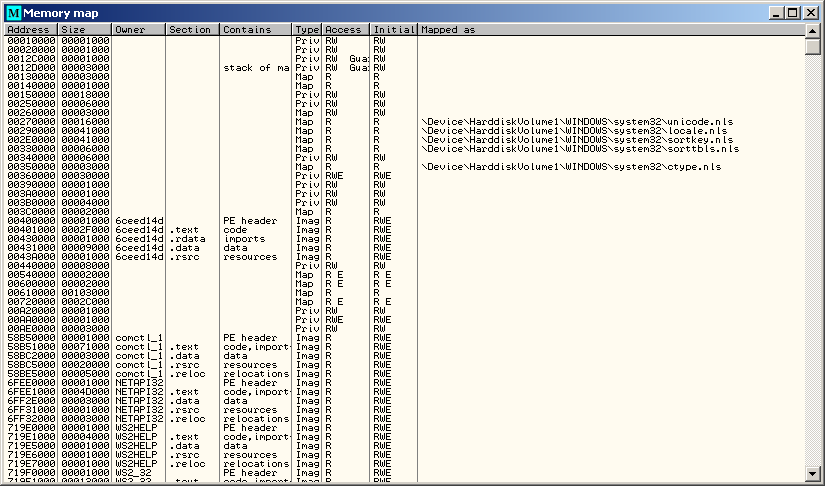
Memory map
The Memory Map window displays all memory blocks allocated by the debugged program. If you double click on a row, it will bring you to the memory dump of the section.
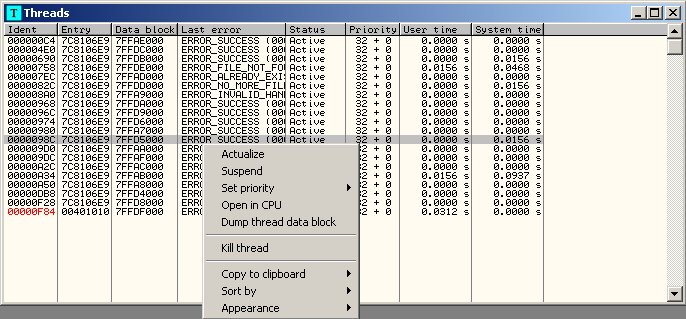
Threads
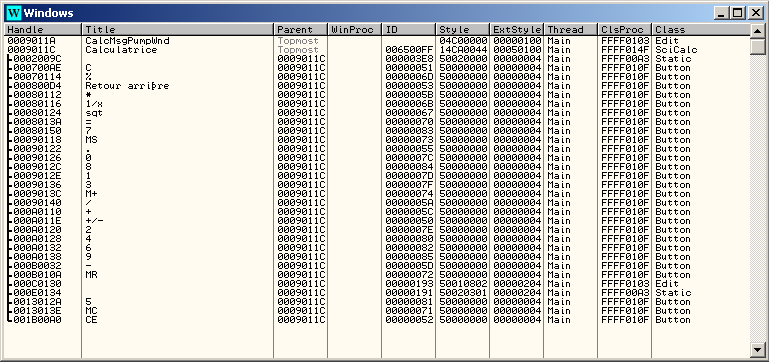
Windows
Handles
CPU
Display the main interface.
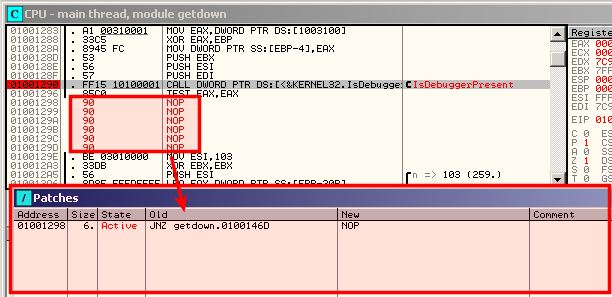
Patches
Shows modifications (patches) that have been applied to the code.
Call stack of main thread

Thank you for your comprehension.
Breakpoints

Thank you for your comprehension.
References

Thank you for your comprehension.
Run trace

Thank you for your comprehension.
Source

Thank you for your comprehension.
Debugging malware
Load malware
Open an executable

Thank you for your comprehension.
Attaching to a Running Process

Thank you for your comprehension.
Load a DLL

Thank you for your comprehension.
Executing the malware
Run (F9)
Commonly used to run the analyzed executable immediately or after a breakpoint has been reached.
Run to selection (F4)
Run until the selected instruction
Pause (F12)
Very seldom used. Enables to pause the analyzed executable
Step into (F7)
Execute a single instruction and pause. Dive into the function's instructions.
Suppose we are analyzing the following code:
Step into will follow the function and the debugger will pause at the first instruction of the called function:
Step over (F8)
Execute a single instruction and pause. If the instruction is a function, does not dive into the function's instructions
In the previous example, step over will make the debugger pause at the next line:
Execute till Return (Ctrl+F9)
Will pause execution just before the current function is set to return.
Useful when you want a program to pause immediately after the current function is finished executing
Execute till User (Alt+F9)
Useful during malware analysis if you get lost in the code.
Will cause the program to run until the execution returns to compiled malware code (typically the .text section)
Execute a given function
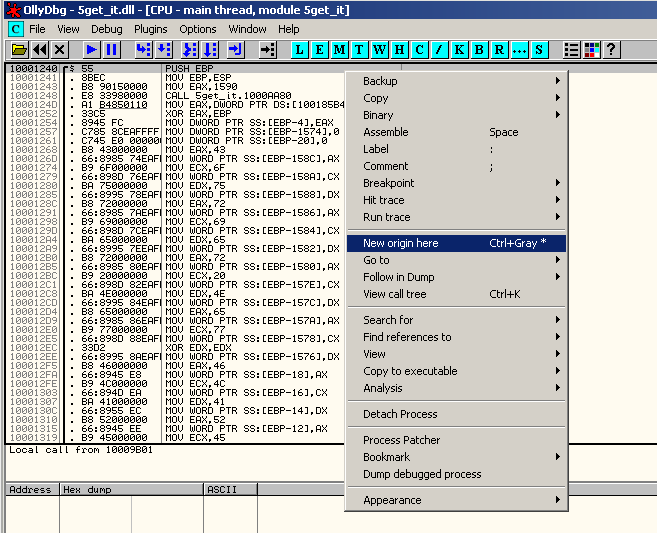
This can be useful when debugging a DLL. It consists of modifying the EIP to point to the address of the function to be executed.
Go to the address of the function (Ctrl+G), right click and select "New origin here":
Then press F9 to run the executable.
Breakpoints
- Software breakpoint
- To implement a software breakpoint, go to the line you want the program to pause and hit F2 or right click and select "Breakpoint > Toggle".
- Hardware breakpoint
- To implement a software breakpoint, right click on the line where you want to set the breakpoint and select "Breakpoint > Hardware, on Execution".
- Conditional breakpoint
- To implement a software breakpoint, go to the line you want the program to pause and hit Shift+F2 or right click and select "Breakpoint > Conditional".
- Memory breakpoint (on access)
- To apply a memory breakpoint on access (read, write or execute), select "Breakpoint > Memory, on Access" from the right-click menu.
- Memory breakpoint (on write)
- To apply a memory breakpoint on access (read, write or execute), select "Breakpoint > Memory, on Write" from the right-click menu.
Tracing
- To activate the trace: Debug > Trace Into (or Ctrl+F11)
- To see the trace log: View > Run trace
Plugins
- Command Line
- Hide Debugger
- Hide OD (Hide Olly)
- Olly Advanced
- OllyBonE
- OllyDump
- OllyScript
- PhantOm
- StrongOD

