Category:Digital-Forensics/Computer-Forensics/Debugger
| You are here: | Debugger
|
Description
A debugger is a program that aids developers understand the behavior of a source code while it's being written (source-level debugging) and malware analysts run a compiled code (assembly or low-level debugging) in the realm of dynamic analysis to study malware behavior.
With a debugger, you can also modify the execution flow.
Source-level / Assembly-level debugger
- A source-level debugger (e.g. debugger embedded into AptanaStudio) enables to debug an application while it's being written. The debugging features (e.g. set a breakpoint) are embedded into most of the Integrated Development Environments (IDE).
- An assembly-level debugger (e.g. OllyDbg) is a low-level debugger. It operates on assembly code. There are 2 levels:
User-mode vs Kernel-mode
Description

Thank you for your comprehension.
More information on Kernel-mode debugging can be found here.
Tools
| Tool | User-mode | Kernel-mode |
|---|---|---|
| OllyDbg | ⚫ | |
| WinDbg | ⚫ | ⚫ |
Debugging operations
Single step
Single-stepping consists of stopping the program after each instruction. You can step-in(to) or step-over:
- Step-in: if you step into before a call instruction, the debugger will enter into the function that is called
- Step-over: if you step over, the function will be bypassed and the debugger will stop immediately after the function returns.
Breakpoints
Software execution breakpoints
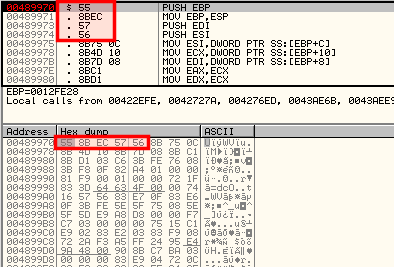
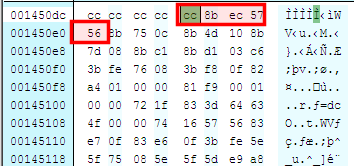
A debugger implements a software breakpoint by overwritting the first byte of an instruction with the INT3 instruction (0xCC). When the 0xCC instruction is executed, the OS generates an exception and transfers control to the debugger.
In the below example, we have defined a software breakpoint. As you can see in the dump pane, the instruction inside the debugger is still 0x55 whereas the value in memory confirms the presence of the software breapoint (the first byte has been replaced by 0xCC)
| In debugger | In memory |
|---|---|

|

|
Hardware execution breakpoints
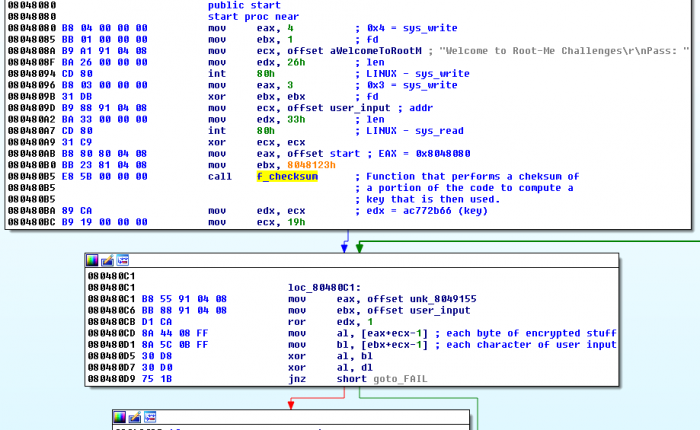
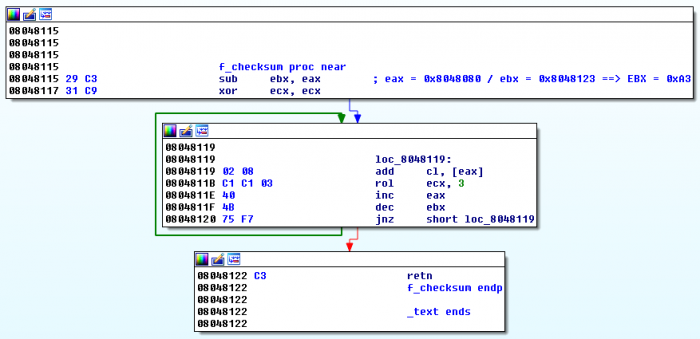
Unlike software breakpoints, with hardware breakpoints, the debugger will break at the address where the breakpoint is defined, whatever byte is stored at the address. It is very convenient to debug code that modifies itself or that performs checksum. Below is an example.
If you use a software breakpoint at 0x80480BA, the debugger will modify the code to break at that instruction, and the checksum of the portion of the code computed by f_checksum at 0x80480B5 will be wrong. In this case, you should rather use a hardware breakpoint.
Another advantage is that it is possible to define breakpoints on access (read, write) rather than on execution.
Since hardware breakpoints rely on given registers (only 4 available), it is only possible to define 4 hardware breakpoints.
Conditional breakpoints
Conditional breakpoints are implemented as software breakpoints that will stop the execution of the program when a given condition is met.
Memory breakpoints
A memory breakpoint allows to set a breakpoint on a chunk of memory in order to have the code break on access to that memory.
It's particularly convenient to use memory breakpoints during malware analysis to identify when a DLL is loaded (pause execution as soon as code in the DLL is executed).
Exceptions
Exception handling
- Most programmation languages enable the interception of exceptions (e.g. division by zero) so that the program will print a message to the user or won't execute an instruction, instead of crashing. This is the first-chance exception.
- If an exception is not handled, the debugger is given a second chance exception. The debugger must resolve the exception to allow the program to run.
Common exceptions
- INT3
- Single-stepping
- Memory access violation
Comments
Subcategories
This category has only the following subcategory.
Pages in category "Digital-Forensics/Computer-Forensics/Debugger"
The following 21 pages are in this category, out of 21 total.

